
Asteroid 1 Ceres Observation Details
Ceres Daily Motion
Ceres will reach its transit before twilight, at 14:34. By the onset of twilight at 16:58, it will be at elevation, and it will set before sunrise, at 20:30.1 Ceres will be visible until February, 28, when it will move too close to the Sun. During this time, its proximity to the Sun will cause it to disappear from the night sky, making it unobservable for a while.
Ceres Visibility Timetable on January 30
Ceres Rise and Set Timetable
| Time | Elevation | |
| Moon Rise, 88% illuminated | 11:52 | 36° |
| Ceres transit | 14:34 | 52° |
| Sunset | 15:27 | 50° |
| Civil sunset | 15:56 | 47° |
| Astrosession begin | 16:58 | 39° |
| Ceres set | 20:30 | |
| Astrosession end | 03:42 | -50° |
| Moon Set | 03:44 | -50° |
| Ceres rise | 08:35 |
Track Ceres Position Throughout the Night
← Fri, 30 January 2026 →
| Time | |
| Altitude | |
| Azimuth |
Shift the map to change the time and observe Ceres changing position in the night sky.
Ceres Description
Ceres, designated as 1 Ceres, is a main-belt asteroid, located between Mars and Jupiter in the solar system. With a diameter of 940 km, 1 Ceres completes its orbit around the Sun in 4.6 years. At the moment, 1 Ceres is 3.142 AU (470,036,510 km) from Earth, and it is located in the constellation Cetus.Current position of Ceres in Solar System
| Date | Fri, 30 January 2026 |
| Distance from Earth to Ceres | 3.146 AU (470,634,901km) |
| Elongation | 65° |
| Angular diameter | " |
| Magnitude | 9.09 |
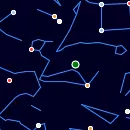
Finder Chart for Ceres
Double-click to unlock the map.
| Object name | 1 Ceres |
| Field of view | |
| Limiting magnitude | |
| 1 Ceres coordinates | 1.0588341190349, -1.0119320237123 |
| Center coordinates | 1.0588341190349, -1.0119320237123 |
Annual motion of Ceres
| Date | Fri, 30 January 2026 |
| Twighlight start | 16:54 |
| Twighlight end | 03:37 |
| Twighlight duration | 11h 43m |
| Rise | 08:34 |
| Set | 20:27 |
| Elevation at transit | 52° |
| Transit time | 14:31 |
| Equatorial coordinates | RA: 01h 04m 34s", Dec: 00° 50' 51s |
| Magnitude | 9 |
| Constellation | Cetus |
The graph illustrates the annual visibility pattern of a Ceres, providing a comprehensive overview of its daily appearances and transit times throughout the year.
The graph is structured with the vertical axis showing the hours of the day, ranging from 12 AM to 12 AM the next day, while the horizontal axis spans each day of the year.
The reddish shaded area indicates the periods when the Ceres is above the horizon, visible to observers. The white line marks the times when the celestial object reaches its highest point in the sky each day, known as the transit.
Astrometric & Physical Parameters of 1 Ceres
Coordinates & Visibility
| Right Ascension | 1.0588341190349° |
| Declination | -1.0119320237123° |
| Magnitude | 9.09 |
| Constellation | Cetus |
| Elevation | -0.1° |
| Azimuth | -91.2° |
Physical properties
| Mean radius in kilometres | 476.2 |
| Equatorial radius in kilometres | 487 |
| Polar radius in kilometres | 455 |
| Boby mass in kg | 9.393E+20 |
| Body volume in km3 | 4210000000 |
| Body density in g.cm3 | 2.161 |
| Surface gravity in m.s-2 | 0.28 |
| Escape speed in m.s-1 | 510 |
| Axial tilt | 3 |
| Mean temperature in K | 168 |
Orbital Parameters
| Sideral orbital time for body around another one (the Sun or a planet) in earth day | 1681.63 |
| Sideral rotation, necessary time to turn around itself, in hour | 9.07 |
Data Acknowledgment
Our solar system data—including planetary physical and orbital parameters—comes from the Solar System OpenData API , maintained by Le Système Solaire. We thank Christophe and the contributors for making this open data available.
Acknowledgments
We acknowledge NASA's Jet Propulsion Laboratory (JPL) for providing essential data on asteroids and comets through their Small-Body Database (SBDB) and Center for Near-Earth Object Studies (CNEOS). Their continuous efforts in tracking and cataloging these celestial bodies make it possible to offer accurate and up-to-date information on their positions, orbits, and physical characteristics.